Written by David Li, Anna Roth
Introduction
Visual graph layouts are a nice tool to quickly spot symmetries and other structures on graphs. As common graph layout tools, such as Gephi, can only layout graphs in Euclidean space, our goal in this semester’s project “Physical Graph Layout in Hyperbolic Space” was to implement an algorithm to layout graphs in hyperbolic space, that is, on the Poincaré disk model.
Theory
Our algorithm of choice was the already existing “Force Atlas 2” algorithm [Jacomy et al.]. This algorithm works by applying forces to the vertices of the graph: All the vertices repel each other, while edges act as “springs” that pull vertices together. A third force, gravity, pulls all vertices towards the center of gravity, in our case the center point of the Poincaré disk. All these forces depend on distances between the respective points, and applying them means moving a point in a direction. In contrast to Euclidean space, neither distances nor directions in hyperbolic space are straight forward.
Progress
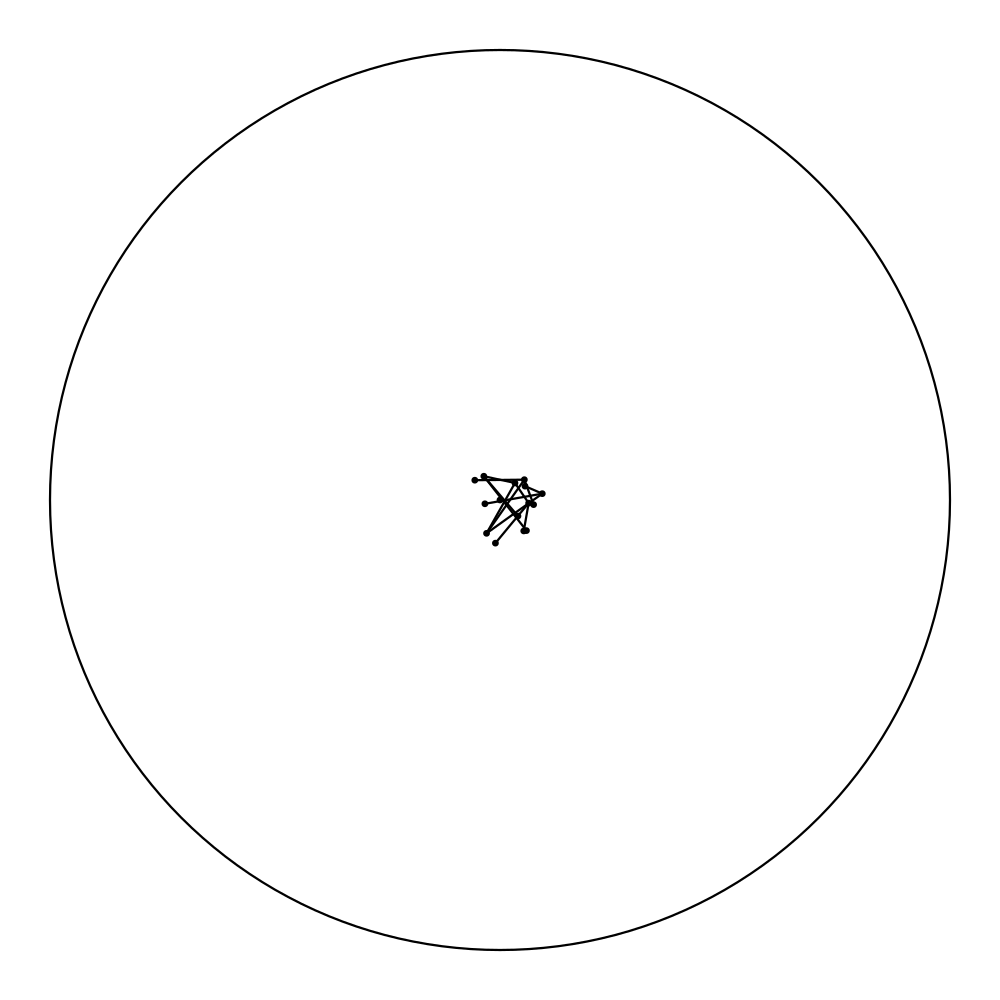
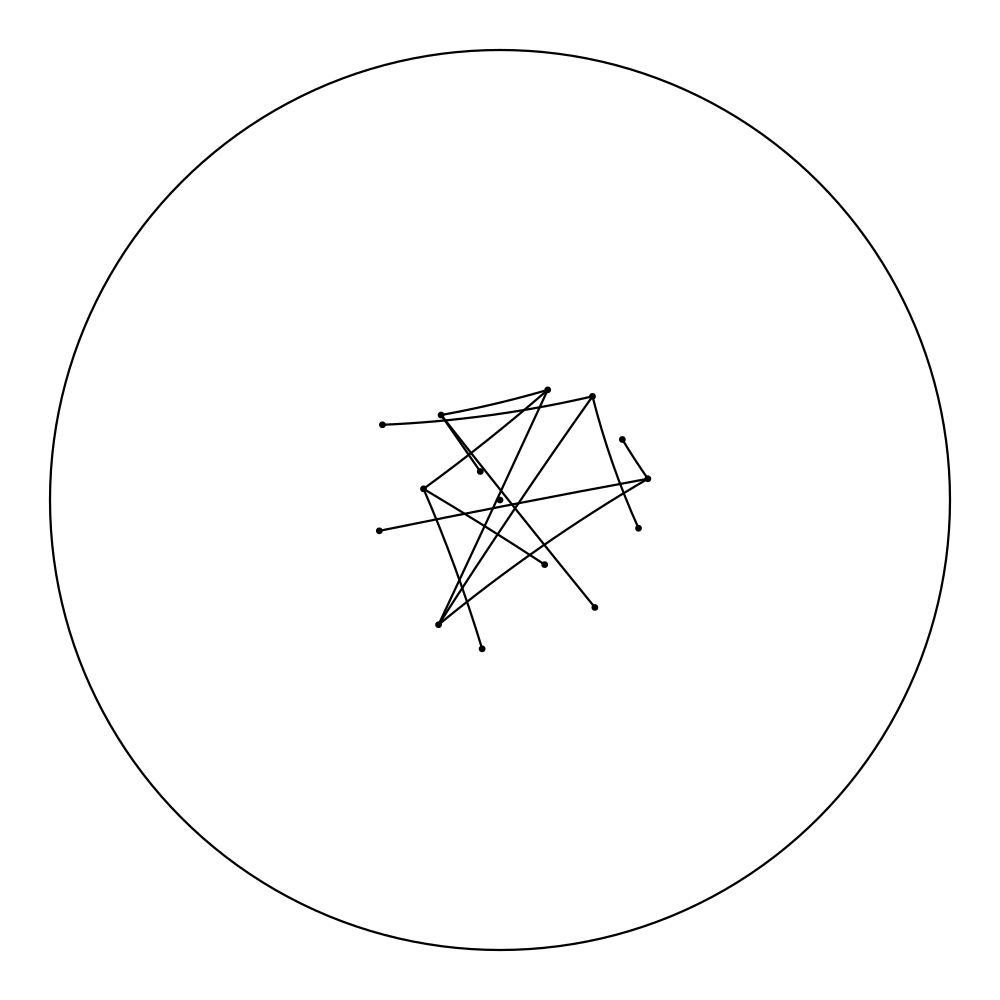
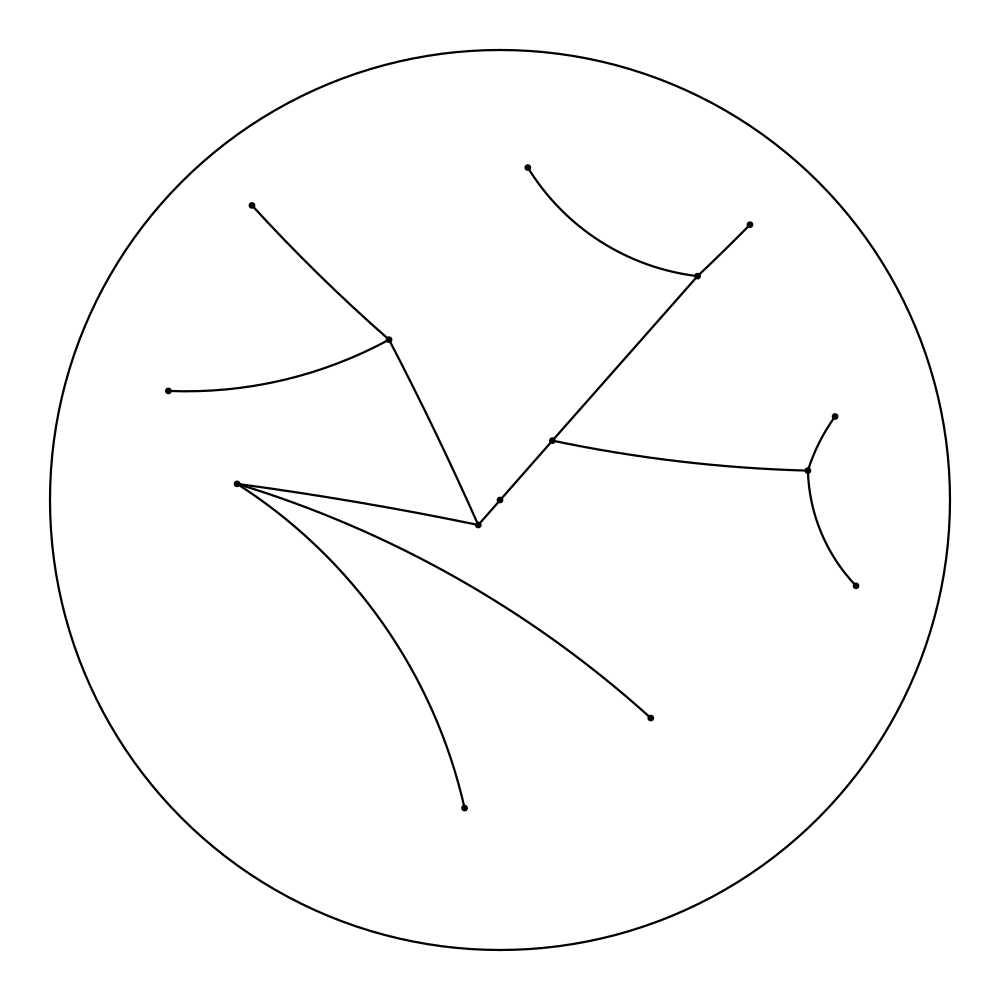
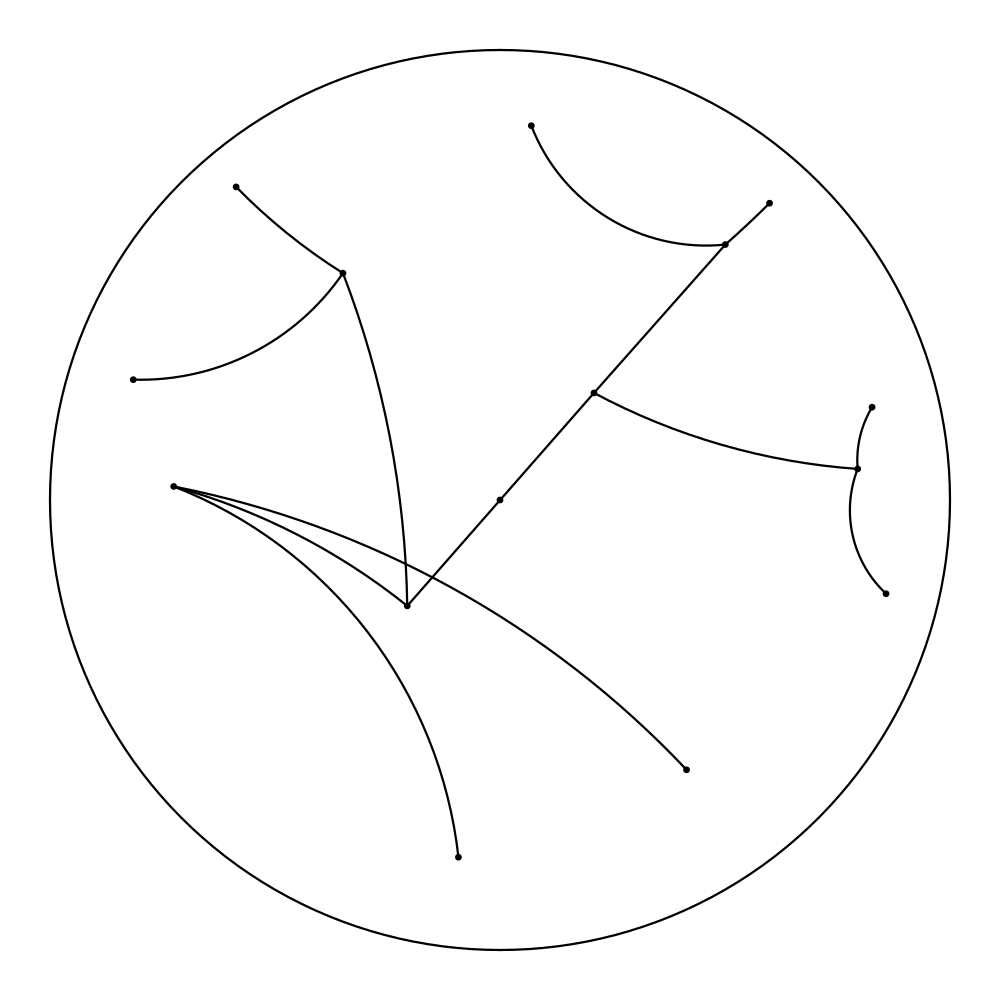
At the moment, our program consists of a primitive user interface that permits applying the hyperbolic Force Atlas 2 algorithm to graphs in the form of plain text files containing all the edges. For the first step, the vertices are randomly mapped to points near the center of the Poincaré disk. After a specified number of iterations, the layout will be graphed and one has the opportunity to manually move vertices within the scope of the Poincaré disk, in case the graph gets stuck in an undesired equilibrium. After every step, the resulting layout gets saved as .png file, and when the algorithm has finished, the pictures get compiled into a GIF, if desired.
For starting the algorithm, one can input different constants that regulate the repulsion and gravity forces affecting the vertices, as well as a so-called “swing” that prevents the overall forces within the algorithm getting too big, and therefore the vertices from oscillating uncontrollably.
Issues
While programming the algorithm, we encountered different problems that have yet to be solved: For using the algorithm and getting a meaningful picture, one has to choose constants. We have not yet found what constants work well for what graphs. Good choices on constants seem to depend on the number of vertices. This problem in part comes from the fact that the Poincaré disk has a set radius and the graph gets very small when further away from the center, contrary to the Euclidean case, where the absolute size of the visualized graph doesn’t depend on it’s location in space.
Another consequence of the use of the Poincaré disk model is the small scope of the calculations: As the Poincaré disk has a radius of one and the calculations use Euclidean coordinates in the background, sometimes very small numbes occur, which leads to numerical errors. Especially close to the edge of the Poincaré disk these errors can lead to points glitching out of the disk.
The third problem is a convenience issue: At the moment, the algorithm has quite a long runtime, so it isn’t feasible to be used for large or even mid-sized graphs.
Outlook
Regarding the future of this project, besides some bug fixes, there are different areas that would be interesting to tackle: First, there is the subject of usability of this tool. The goal here is to improve the user interface so that constants can be changed on the run and iterations and changes on the layout can be controlled more easily.
Second, there is the issue of runtime, which might be significantly improved by implementing strategies to simplify calculations, for example the Barnes-Hut algorithm that reduces the necessary amount of calculations by treating far away clusters of vertices as a single node. This should permit use of the algorithm for larger graphs, which might yield some interesting results.
Finally, due to the fact we separated the geometry from the algorithm, it is natural to think about what happens to graphs when using other geometries. When the according geometries, which all come with their own difficulties, are implemented, one could layout graphs on a sphere or a torus or even higher-dimensional objects, as the algorithm itself is not even restricted to the planar case.
Pictures
So now, after you’ve read all the theory, we don’t want to deprive you of some nice pictures: